The Dashboard is the first page you see after signing in. It sums up listings, clients, completed deals and revenue: for the whole agency if you are an admin, and for your own work if you are an agent.
Reports is for agency admins. It shows how many leads came in, how fast the team answered them and where they came from. It is a lead-response report, not a sales report: for an agent’s sales, open their profile under Agents (see Team and roles).
The dashboard for agency admins
Open Dashboard, the first item in the menu. Four cards sit at the top.
| Card | What it counts | The line under it |
|---|---|---|
| Total properties | The agency’s listings. | How many were added this month. |
| Total clients | The agency’s clients. | How many joined this month. |
| Completed deals | Deals with the status Completed, plus completed sales of project units. | How many of them were entered this month. |
| Total revenue | The final prices of completed deals and completed unit sales, added up for each currency. | This month’s revenue. |
Revenue is shown one total per currency. Euros and lek, for example, are never added together or converted.
Below the cards:
- Deals trend: completed deals per day. Switch between Week (the last 7 days) and Month (the last 30 days). The number at the top is the last day’s count, with its change from the day before, or “No change”.
- Property category distribution: a pie of the agency’s sold and rented listings by category, in percent.
- Awaiting approval: up to five of the agency’s newest listings still waiting for SADE’s review. Click one to open it. See Review and publishing.
- Top agents: up to five agents ranked by this calendar month’s completed deals and unit sales, with their Deals, Props (the number of different properties in those deals), Revenue per currency and Score. Click an agent to open their profile.
The Score is deals × 100 plus properties × 10. An agent with two completed deals on two listings scores 220.
Note: Completed deals counts this month by the day the deal was entered in the CRM. Top agents counts this month by the deal date. A deal entered on 2 November with a deal date of 30 October is in this month’s card line, but not in November’s Top agents.
The dashboard for agents
An agent’s dashboard has the same four cards and the same two charts, about their own work only:
- Total properties: the listings assigned to them.
- Total clients: their clients.
- Completed deals and Total revenue: their own completed deals.
- Deals trend and Property category distribution: their own deals and their own sold and rented listings.
The Awaiting approval and Top agents tables are filled in for agency admins only.
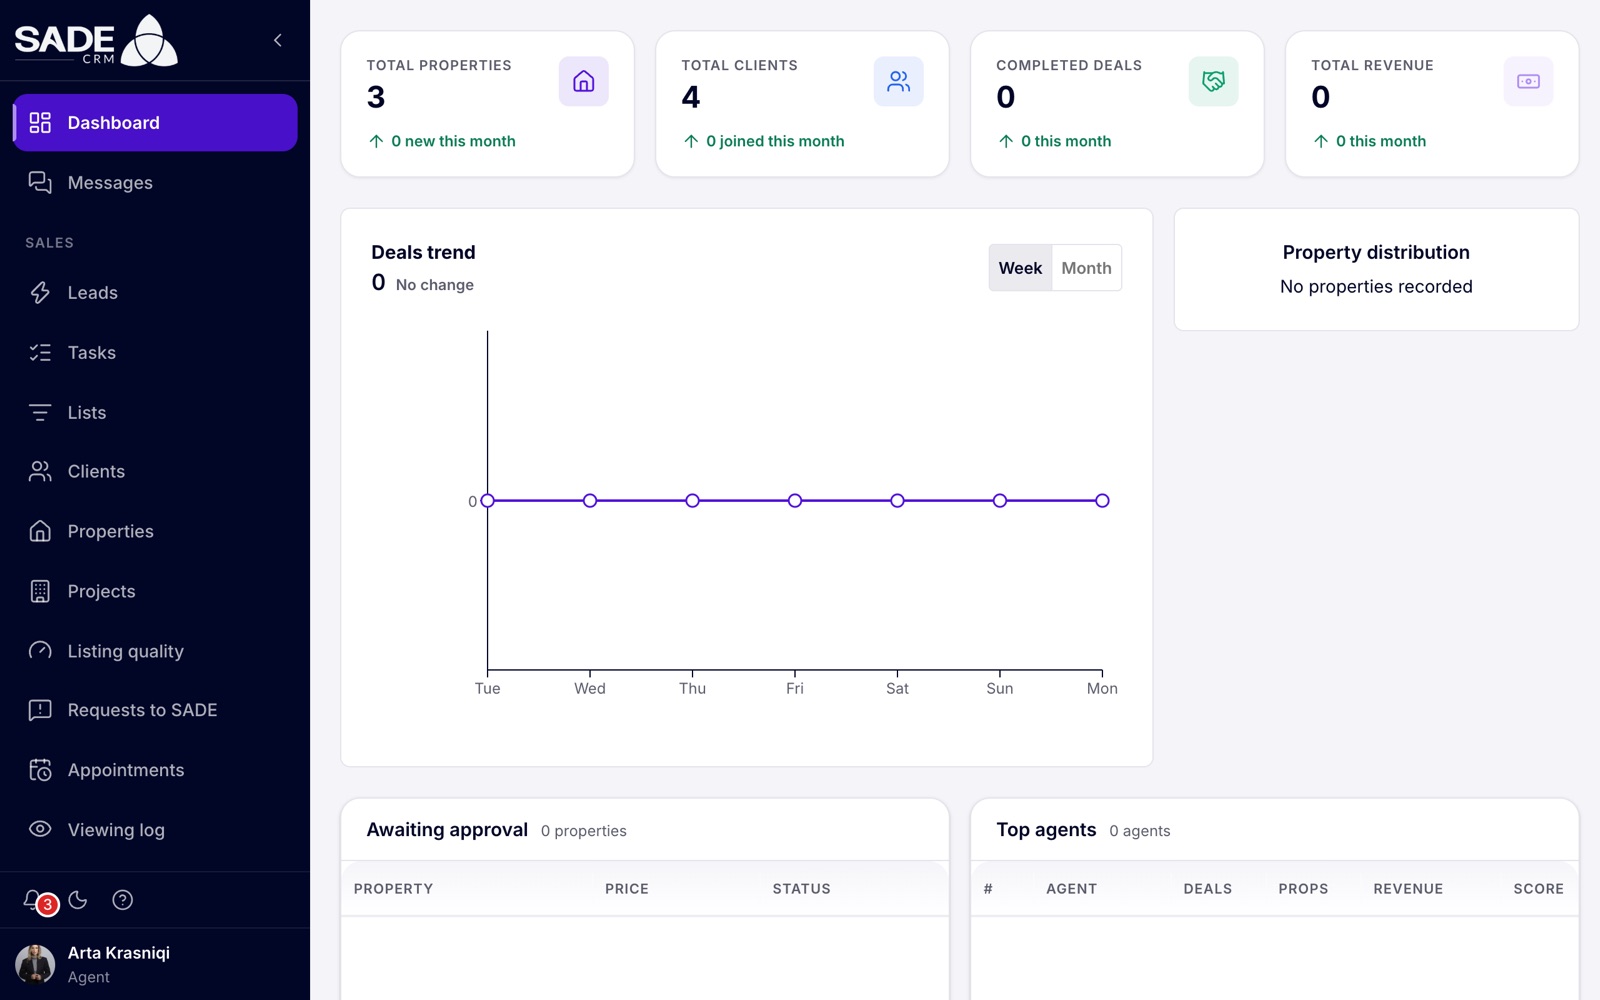
Arta Krasniqi’s dashboard: three listings, four clients and no completed deals yet.
The dashboard for developers
A company that signed up as a developer gets a projects block above the usual dashboard. It shows units Available, Reserved and Sold across all projects, and Enquiries (leads about projects), with a table of up to five projects and an All projects link. See Projects overview.
Banners at the top
Two banners can appear above the dashboard, and above every other page:
- the plan banner, when your plan has ended or a payment is due (see Plans and billing);
- the verification banner, while your agency is not yet verified and its listings are not on the marketplace (see Verification).
The guided tour
The first time you open the dashboard in a browser, a short tour of its parts starts. Click Skip for now to close it, or Start tour. To see it again, click the ? button at the bottom of the menu.
Reports
Open Reports in the Team part of the menu. Only agency admins have it.
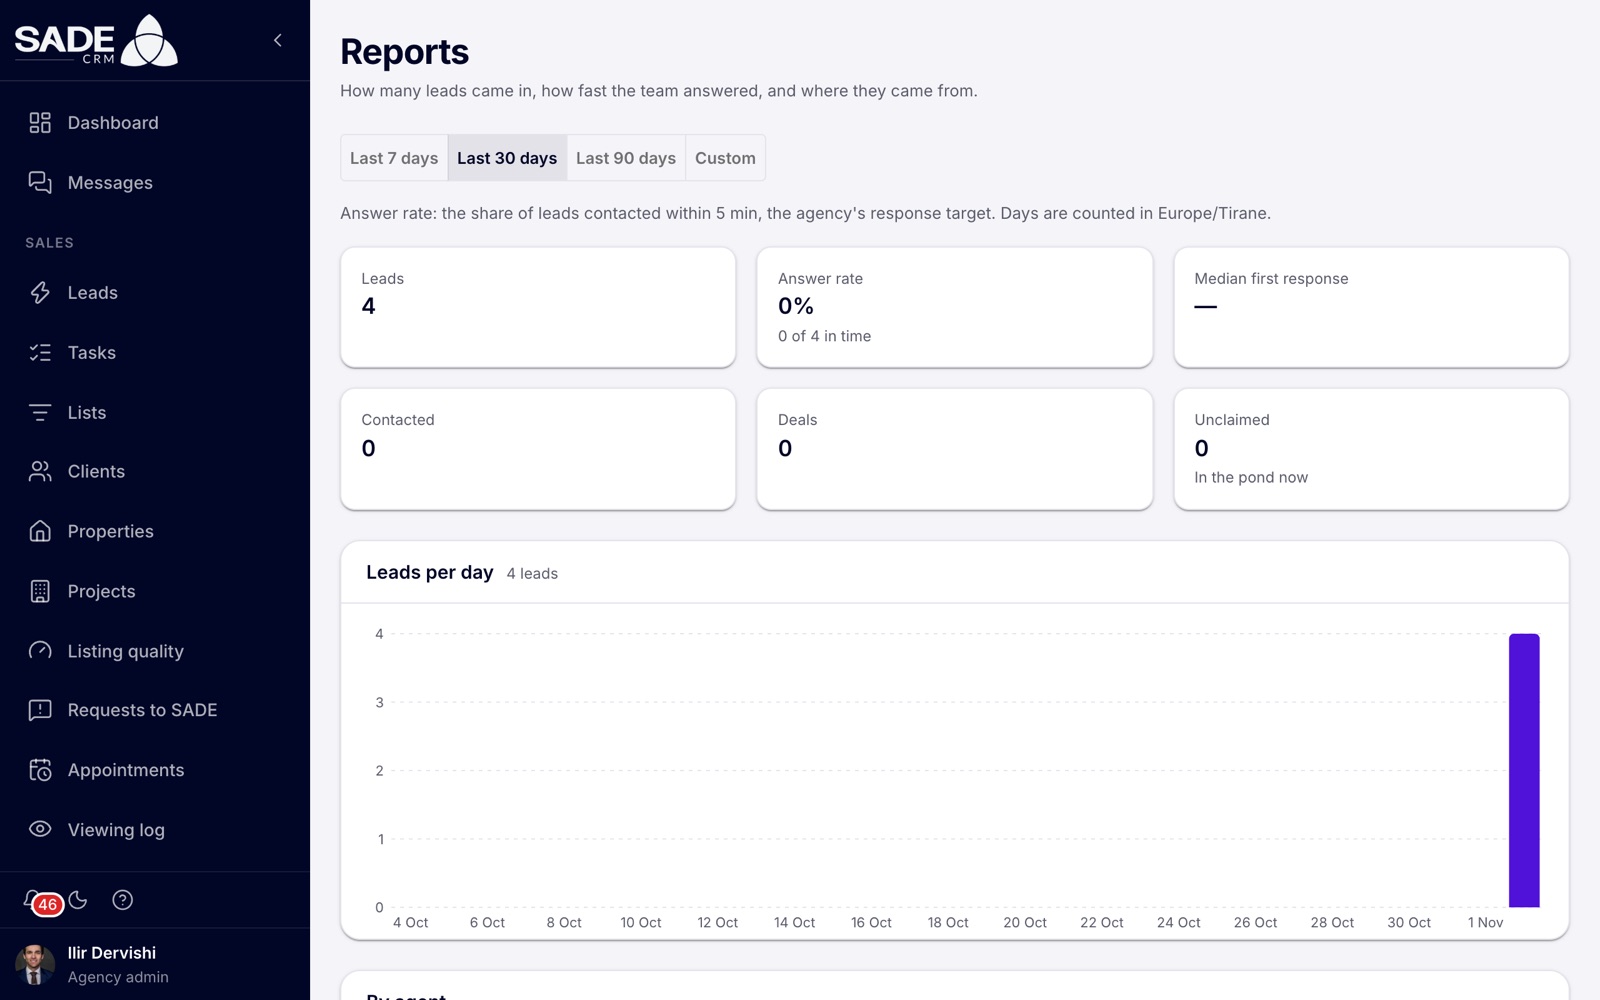
Reports for the last 30 days.
Choosing the period
Choose Last 7 days, Last 30 days (the default), Last 90 days or Custom. With Custom, set From and To.
Days are counted in the agency’s time zone, which the page names, for example “Days are counted in Europe/Tirane.” The time zone is set in Agency settings.
What counts as a lead
A lead here is a new enquiry that starts a response timer: someone new asking to be contacted, or a client you already have who asks again when no timer is running for them. Leads from the marketplace, website forms and your other sources all count. Clients you add by hand are not leads and are not counted.
A lead is contacted when someone logs a call, WhatsApp, email, SMS or meeting with them (with any outcome, including No answer), or moves them past Attempted Contact. See Following up.
The response target is the agency’s Contact new leads within time in Lead routing. It is 5 minutes unless you change it. The page repeats it: “Answer rate: the share of leads contacted within 5 min, the agency’s response target.”
The tiles
| Tile | How it is counted |
|---|---|
| Leads | Leads that arrived in the period. |
| Answer rate | Leads contacted within the response target, as a share of all leads in the period. Leads never contacted count against it. The line under it reads, for example, “16 of 25 in time”. |
| Median first response | The middle time from a lead’s arrival to its first contact, among the leads that were contacted. Half were answered faster, half slower. |
| Contacted | Leads in the period that have been contacted, in time or not. |
| Deals | How many of those leads’ clients have a deal, of any status, created since the start of the period. |
| Unclaimed | Leads in the period that were never given to any agent: still offered or still in the pond. |
Leads per day charts the leads that arrived on each day of the period.
By agent and by source
By agent has a row for each agent who has leads in the period.
| Column | What it shows |
|---|---|
| Agent | The agent whose lead it is now. |
| Leads | Their leads in the period. |
| Claimed | How many of those they claimed from an offer or the pond. |
| Contacted | How many they have contacted. |
| In time | How many they contacted within the response target. |
| Median response | Their middle response time. |
| Deals | How many of those leads’ clients have a deal. |
An agent’s response time counts from when the lead became theirs. For a lead they claimed, that is the moment they claimed it, not the moment it arrived.
By source has the same columns, without Claimed, for each source: SADE Marketplace, a website form, a portal and so on. The source is the client’s original source. Leads with no source show as “Unknown”. Response times here count from the lead’s arrival.
There is no export from Reports. The only Excel download in this part of the CRM is on Deals.
Tip: if the answer rate is low, open Leads and look at Everyone’s uncontacted leads to see who is waiting right now.
On the phone app
The phone’s Home tab shows the same kind of summary: revenue per currency, deals closed, listings and clients, the activity chart, the coming week’s viewings and quick actions. Admins also see listings waiting for approval and the top agents. Reports is not on the phone. See The mobile app.
Example
Every Monday Ilir Dervishi, admin of Tirana Living Real Estate, opens Reports and picks Last 7 days. There were 25 leads. 16 were contacted within the agency’s 5-minute target, so the Answer rate is 64% with “16 of 25 in time”. 21 were contacted in all, and the Median first response is 4 minutes. 2 leads are Unclaimed, still in the pond.
By source shows most leads came from SADE Marketplace and five from the agency’s website form. By agent shows Erjona Hasani claimed six leads from the pond and answered five of them in time, counted from when she claimed each one.
He then opens Dashboard. Under Top agents, Arta Krasniqi leads with 2 deals on 2 listings in November: a Score of 220. Total revenue shows €228,000 and, as a total of its own, the lek from the agency’s one completed rental.
Something unclear or missing? Write to [email protected] or call +355 69 808 0118.